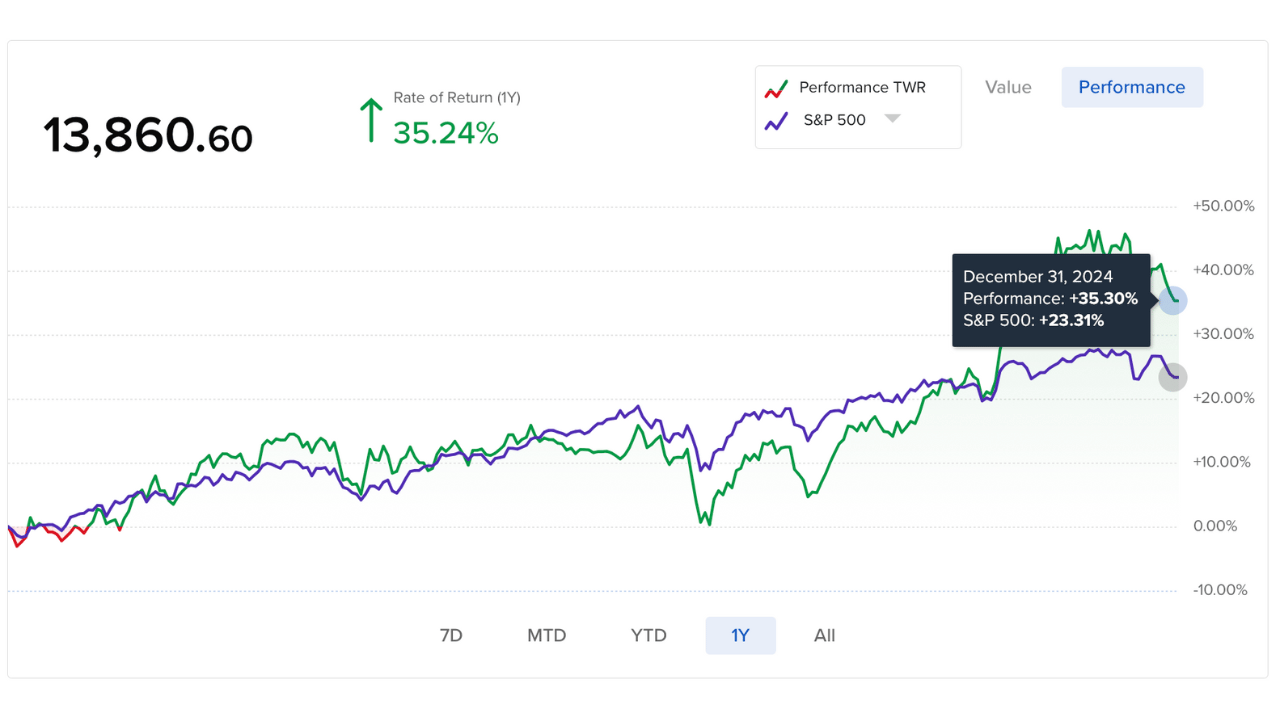
2024 is in the books and it’s time to reveal the performance of the Asymmetric Portfolio. There were ups and downs but at the end of the day, the portfolio was up 35.30%, beating the S&P 500’s 23.31% return.
Below is a look at the portfolio’s statistics.
2024 Asymmetric Portfolio Performance
The Aymmstric Portfolio’s real money performance chart is below. This is a screenshot from Interactive Brokers, the brokerage I use for this real-money portfolio.

*Reminder, I started using Commonstock as a third-party tracking tool, but they were acquired in 2023. I now use Savvy Trader to track performance, which is what you will see in weekly articles, but it’s not a perfect tracker of performance, including trade timing and brokerage fees. This is the real-money performance.
Asymmetric Portfolio Stats
Here are the stats as of December 31, 2024.
Total Amount Invested: $10,500.00
Total Portfolio Value: $13,860.60
Here are risk metrics that investors often cite.
Sharpe Ratio: 1.22
Sortino Ratio: 1.79
Turnover: 21.1%
Max Drawdown: 13.43%
Standard Deviation: 1.40%
If you want to see my monthly buys and in-depth research, sign up for Asymmetric Investing Premium here. It’s $100 per year, less than you might pay a financial advisor to invest just $10,000 of your money. If you invest $100,000, you pay an advisor over $1,000…and they probably aren’t beating the market.
Disclaimer: Asymmetric Investing provides analysis and research but DOES NOT provide individual financial advice. Travis Hoium may have a position in some of the stocks mentioned. All content is for informational purposes only. Asymmetric Investing is not a registered investment, legal, or tax advisor or a broker/dealer. Trading any asset involves risk and could result in significant capital losses. Please, do your own research before acquiring stocks.

